
Client Projects
Visualizing GDELT | Learning Analytics for PLAE Project | Mapping the Knowledge Landscape of Design
THOR: Uptake and Reach of Data and Researcher PID Services | Visualizing User Behavior on the Places & Spaces Website
Visualizing IU e-Text Usage and Achievement | GloBI: Social Graph of Life on Earth | Scientometric Mapping of Interpreting
Globalization of the United States, 1789-1861
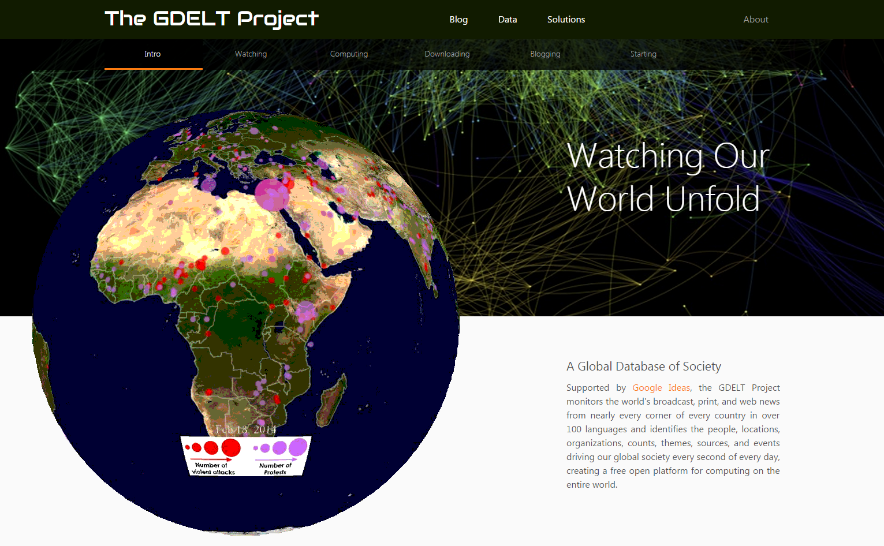
Visualizing Our Global World
Client Name: The GDELT Project
Project Description (goal/scientific or practical value):
The GDELT Visual Global Knowledge Graph explores the visual narratives
of the world's online news media imagery. Each day it samples up to
700,000 online news images from across the planet and processes them
through Google's Cloud Vision deep learning algorithms to catalog the
objects, activities, facial emotions, text OCR, violence levels and even
location estimation and codify this as a massive graph over the world's
visual representations. We'd love to see what can be done to understand
visual portrayals across the world.
Information on dataset(s) to be used:
GDELT Visual Global Knowledge Graph (http://blog.gdeltproject.org/visual-global-knowledge-graph-vgkg-april-2016-snapshot-dataset/). A new snapshot can be made that has the full 175 million image dataset.
Relevant publications, websites, etc.:
GDELT Project website provides an overview of the project.
GDELT Project Blog showcases a number of applications and information about the project.
Blog post annoucing the Visual Global Knowledge Graph data set.
A YouTube video that brief introduces the project can be found in this presentation at the Google Developer Group DevFestDC conference.
Publication Notes:
No restrictions of any kind other than requesting that all work include a citation to the GDELT Project website.
I would love to see students widely publish and disseminate their
results and maximize visibility of what they are able to do with the
data.
Learning Analytics for PLAE Project
Client Name: Joshua Danish
Project Description (goal/scientific or practical value):
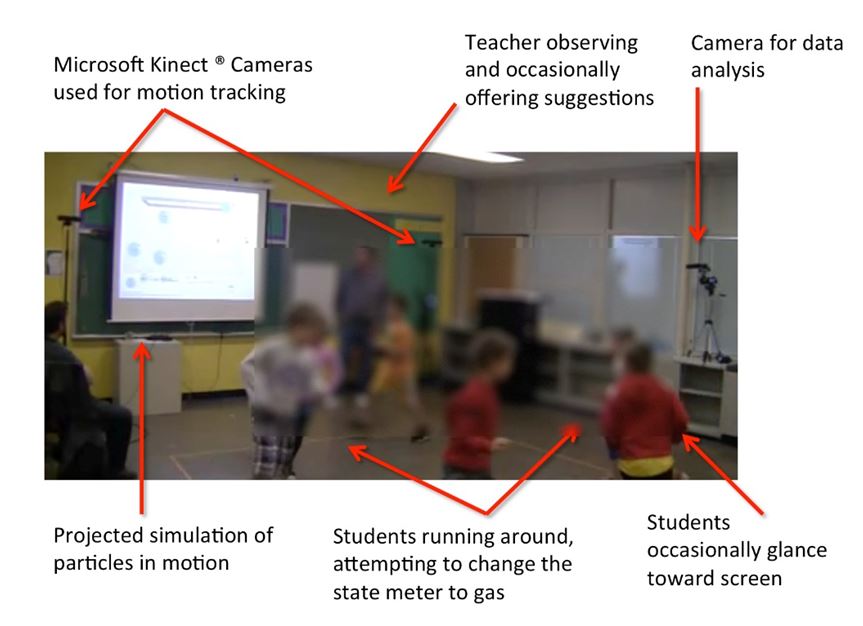
The PLAE Project (https://www.nsf.gov/awardsearch/showAward?AWD_ID=1522945)
explores how young students can learn about complex science concepts by
engaging in embodied play activities that are tracked using the
OpenPTrack system (http://openptrack.org).
Their actions are incorporated into a computer simulation, and students
also have an opportunity to annotate the simulation using an iPad app.
In the next iteration, our goal is to begin analyzing the log data of
students' motion along with key events from the simulation to enhance
our prior analyses using pre/post measures and video data. Being able to
visualize this kind of information will advance both the current
research focus on learning, and also the field's attempts to use
multimodal learning analytics.
Information on dataset(s) to be used:
Our goal is
to be able to analyze log data generated by this system. Depending on
the timing, we may be working with simulated log data created by adults
with the hope of re-using any scripts/tools later once data is collected
with students. Either way, data will be de-identified and thus
shareable. Data will consist of two streams of Excel readable data
tables where one includes: tracking positions of individuals within the
system generated by the OpenPTrack system, and the other includes
simulation generated events. The data will need to be stitched together
based on entity ID and timestamp.
Relevant publications, websites, etc.:
PLAE is an extension of the STEP project: http://crlt.indiana.edu/projects/step.html
A video can be seen here: http://stemforall2016.videohall.com/presentations/726
http://www.joshuadanish.com
Publication Notes:
Analysis of students movements
will need to be discussed with the PLAE team, but presentations about
the visualization and similar can be done so long as the PLAE project is
acknowledged.
Mapping the Knowledge Landscape of Design
Client Name: Dr. Eswaran Subrahmanian
Project Description (goal/scientific or practical value):
The goal of this project is to trace the history of research and debate over
the last three decades in areas of “design”. Design being a very vast subject,
the work has both practical and scientific value to the diverse community to see
the scope of design issues and research. This would allow the community to possibly
come together. Students are invited to analyze and visualize the temporal
growth and bursts of activity, to map evolution of collaboration networks, to
overlay the data on a map of science so that changes in topical coverage can
be understood and communicated.
Information on dataset(s) to be used:
Data for
this project includes a publication records collected related to design
and a set of Design Society documents. Publications are collected from 32
design journals was retrieved from the IUNI Web of Science dataset.
It can be shared for the purposes of this project, but cannot be distributed beyond it.
Relevant Publications, websites, etc.:
Website for Dr. Eswaran Subrahmanian
Publication Notes:
Students may use the project
result in their resume and portfolios; for publications, I would like to
approve the results and be co-author.

THOR - Uptake and Reach of Data and Researcher PID Services
Client Name: THOR Project
Project Description (goal/scientific or practical value):
The
EU-funded THOR project (Technical and Human Infrastructure for Open
Research) aims to improve the interoperability of persistent identifiers
(PIDs) for data and researchers, so that every researcher in Europe can
find and connect to her own data and that of her peers. As part of this
project, we are monitoring the landscape of PIDs for trends that can
help us with our outreach efforts. While we have access to the basic
metadata associated with PIDs, we are missing out on additional insights
that can only be gained through a more comprehensive study of all the
available metadata. While we’re undertaking the broader study ourselves,
we’re interested in the insights information visualization students
might have on a subset of the data. Fresh eyes could lead to additional
points of view.
Specifically, the project we are proposing is an assessment of the reach and uptake of PID services for researchers within and across geographical regions. Students will evaluate the ORCID public data files from recent years for insights on the geographical distribution of researchers with ORCID IDs and how that relates to other aspects of the researcher profiles.
Information on dataset(s) to be used:
The ORCID
public data file contains all the information in the ORCID system that
is marked as public. This is information about researchers, such as
their institutional affiliation and their list of attributed works.
More information in the blog post accompanying this year’s data release (https://orcid.org/blog/2016/11/02/another-year-orcid-another-public-data-file-community), or in the ORCID data use policy (https://orcid.org/content/orcid-public-data-file-use-policy).
Relevant Publications, websites, etc.:
THOR project: http://project-thor.eu
ORCID Project Mission: http://orcid.org/about/what-is-orcid/mission
Publication Notes:
Results should be approved
by the THOR project team prior to publication. Publication is encouraged
as long as it includes attribution of the data used (as per the ORCID
public data file’s use policy), the THOR project, and any associated
contributors. The THOR project may reuse the outputs of this work in
future project deliverables, and will credit the students accordingly.

Visualizing User Behavior on the Places & Spaces Website
Client Name: Lisel Record and Mike Gallant
Project Description (goal/scientific or practical value):
The Places & Spaces: Mapping Science
exhibit introduce science mapping techniques to the general public and to
experts across disciplines for educational, scientific, and practical purposes.
It is meant to inspire cross-disciplinary discussion on how to best track and
communicate scholarly activity and scientific progress on a global scale.
The exhibit website scimaps.org) provides information about people behind
the exhibit; showcases maps and macroscopes; lists past, present and
planned exhibit venues; but also links to publications, the store,
news and contact information, etc.
The website underwent a redesign in 2015 to update the organization and user interface of the website and the exhibit curators are interested to understand the impact of this redesign. Analysis and visualization should include: descriptive statistics of visitor demographics and sessions, page visits, and document downloads; geospatial origin of visits; temporal analysis of site traffic, e.g., do burst of activity correlate with press or venue events. Students may suggest other analysis and visualizations. Results may take the form of static or interactive visualizations and/or dashboard tool.
Information on dataset(s) to be used:
The data
set consists of Monthly Webalizer reports for 10 years—covering March
2007 to February 2017—for the website scimaps.org will be provided in
html format.
Relevant Publications, websites, etc.:
Places and Spaces: Mapping Science Exhibit web page
Publication Notes:
Students can publish approved results. Students can add the project's results to their resumes.

Visualizing IU eText Usage and Achievement
Client Name: Dr. Serdar Abaci
Project Description (goal/scientific or practical value):
The
IU e-text program is an ongoing initiative that offers a low-cost
E-Texts platform for students and instructors to engage with relevant
course material, share resources, and interact with peers. Since its
inception within the IU system, over 33,000 users have used the platform
and their interactions with the platform has been stored since 2012.
The project will use data collected in activity logs from the IU E-Texts program to help address the following research questions through statistical analysis and information visualizations:
- How does platform usage differ, both temporally and summatively, across departmental and disciplinary boundaries?
- How does platform usage differ, both temporally and summatively, by student performance?
- If differences in disciplinary and departmental use exist, do these differences influence student outcomes?
- Do past patterns of student and instructor use inform or indicate future uses of the tool?
Project Restrictions: Participation in this project is restricted to students enrolled at Indiana University.
Information on dataset(s) to be used:
The data
set to be used in this project consists of several courses across
several semesters contained in multiple tables. Several of the tables
contain information of anonymized student records and activities within
the E-Texts platform. These tables include the following components:
student gender, class standing, course enrollment information, page
views, annotation/markup activity (e.g., bookmarks, notes, questions),
and grades. Other tables include instructor page views and annotations.
Relevant Publications, websites, etc.:
UITS E-Texts Information Page
Serdar Abaci, Anastasia S. Morrone, and Alan R. Dennis. (2015). Instructor Engagement with E-Texts. EDUCAUSE Review.
Reynol
Junco and Clem, C. (2015). Predicting course outcomes with digital
textbook usage data, The Internet and Higher Education, 27,
http://www.sciencedirect.com/science/article/pii/S109675161500041X
Publication Notes:
My team and I would like to
approve final project results prior to any public presentation of these
results. After the project is complete, my team and I would like to work
with students to co-author a conference or journal publication.

GloBI: Social Graph of Life on Earth Beyond Humans
Client Name: Jorrit Poelen
Project Description (goal/scientific or practical value):
Social
networking platforms document interactions between humans (Homo
sapiens) with increasing detail. Results are interesting to
advertisement and intelligence agencies, but what do we really know
about the other organisms that occupy our planet?
Global Biotic Interactions (GloBI, http://globalbioticinteractions.org) is one of the largest (if not largest!) openly accessible linked (as in http://linkeddata.org) dataset that describes how, when, and where organisms interact. Various projects (e.g. http://gomexsi.tamucc.edu; http://eol.org) currently use the data to their benefit.
One of the challenges in improving and growing GloBI is to better visualize millions of interactions. Currently available tools allow to discover parts of the interaction graph, e.g., what do sea otters eat? However, few comprehensive visualizations exists that show the big picture, e.g., how do all species interact? This project asks students to use the GloBI datasets and develop methods to analyze millions of records and show species interaction patterns between thousands of organisms.
Information on dataset(s) to be used:
GloBI mines
existing datasets that describe how organisms interact. On November
2016, GloBI includes about 2M interactions across over 100,000 taxa (see
https://en.wikipedia.org/wiki/Taxon). This makes GloBI one of the largest, openly accessible resources of species interaction records available today.
The primary data set is provided through GloBI consists of open-access, integrated, species interaction datasets. Secondary datasets might include Global Biodiversity Information Facility (GBIF), Integrated Digitized Biocollections (iDigBio) or similar open-access projects to provide additional information on where and when individual species occurred.
GloBI data records are available in tsv (tab separated values) files, n-quads, web API, R package and JavaScript libraries), among others.
Relevant publications, websites, etc.:
Global Biotic Interactions Project
Global Biotic Interactions Project Blog
GloBI Github Repository
Jorrit H. Poelen, James D. Simons and Chris J. Mungall. (2014). Global
Biotic Interactions: An open infrastructure to share and analyze
species-interaction datasets. Ecological Informatics. http://dx.doi.org/10.1016/j.ecoinf.2014.08.005
Publication Notes:
You are free to publish
results however you'd like. Attribution of the data sources and
associated contributors is highly encouraged. GloBI data is licensed
under http://creativecommons.org/licenses/by-nc/4.0/
Client sponsor:
Jorrit Poelen lives and works in
Oakland, CA and is a freelance software engineer. In the last 15+ years,
Jorrit has been active in academic, government, corporate, and start-up
settings across fields like neuroscience, health informatics, and
financial risk management and, more recently, ecological informatics.
Current project include http://globalbioticinteractions.org, http://effechecka.org, and http://gimmefreshdata.github.io.
Scientometric Mapping of Interpreting
Client Name: Lluis Baixauli-Olmos
Project Description (goal/scientific or practical value):
Although
science mapping is relatively established in other domains, the field
of “interpreting” has not looked at itself from a scientometric
perspective. The project is a first step toward gaining first insights
into this academic field by analyzing the academic articles published in
the main journal in the field, Interpreting, using scientometric
analysis methods and information visualization.
Interpreting is an interdisciplinary journal that publishes research and debate on all aspects of interpreting, in its various modes, modalities (spoken and signed) and settings (conferences, media, courtroom, healthcare and others).
Students will use the citation metadata for 182 articles published in Interpreting from between 2007 and 2016 collected from Scopus. Students will create visualizations that focus on mapping the topic areas covered in the journal, drawing a historical evolution of topics in the field of interpretation, and network visualizations showing collaborations between authors.
Information on dataset(s) to be used:
The project will use citation metadata collected from articles published in Interpreting, and collected from the online database Scopus. The citations include the fields:
- Authors
- Title
- Year
- Cited by
- Affiliations
- Authors with affiliations
- Abstract
- Author Keywords
- References
Publication Notes:
The project sponsor will be a co-author on any publications from this project.
Globalization of the United States, 1789-1861
Client Name: Konstantin Dierks
Project Description (goal/scientific or practical value):
The aim of this historical GIS project is to project historical data
onto historical world basemaps, with an interactive menu to enable users
to choose data, and with an interactive timeline to enable users to
choose a particular historical moment or interval. A second aim is to
create D3 visualizations in dynamic relation to the digital map.
The scientific value of the project is to achieve effective presentation of historical GIS, since modern basemaps do not suit historical data. The practical value is to achieve clear presentation of multiple data variables simultaneously on a digital map as well as a data visualization.
Information on dataset(s) to be used:
The dataset
concerns diplomatic and military activities in the wider world
conducted from the United States between the American Revolution and the
American Civil War. (Historical basemaps can be found online.)
Relevant publications, websites, etc.:
Two interesting websites using historical basemaps:
http://revolt.axismaps.com/
http://dsl.richmond.edu/historicalatlas/
Publication Notes:
The project client requests approval for any publications that come from the results.